That feeling is burned into my memory. Years ago, I launched my first real portfolio website. I’d spent weeks obsessing over every pixel, tweaking every line of code until it felt perfect. It was my masterpiece. My heart was pounding when I sent the link to a big potential client. Pride. Anxiety. A whole mess of emotions. The reply came back way too fast. “Looks interesting, but it took forever to load. I almost gave up.” My stomach just dropped.
All that work. All that passion. It was completely undermined by something I had barely even considered: speed. That one email taught me a brutal lesson. A gorgeous website that no one waits around to see is just digital noise. That experience is the reason I’m writing this guide to boosting page speed Core Web Vitals. This isn’t about chasing algorithms. It’s about respecting the person on the other side of the screen and making sure your message actually lands.
So, this isn’t going to be some dry, technical manual that’ll put you to sleep. Think of it more as a friendly chat. We’ll walk through a roadmap I’ve built from years of making mistakes, fixing them, and finally getting it right. We’re going to pull back the curtain on Google’s Core Web Vitals and give you simple, real-world fixes you can use today.
More in Technical SEO Category
How To Use Google Lighthouse Reports
How To Optimize Your Crawl Budget
Key Takeaways
- It’s All About the User: Core Web Vitals aren’t for Google; they’re for people. They measure how fast a page feels (LCP), how quickly it responds to clicks (INP), and whether it jumps around unexpectedly (CLS). These metrics directly mirror a real person’s experience.
- Speed Is Your SEO Advantage: Let’s be clear: Google uses Core Web Vitals in its ranking algorithm. A faster, more stable site gets a nod. A slow site gets pushed down the list. It’s a competitive edge you can’t afford to ignore.
- A Better Experience Means Better Business: Forget SEO for a second. Page speed hits your wallet. Slow sites have shockingly high bounce rates, kill engagement, and cause people to abandon shopping carts. Fixing your vitals makes for a smoother journey that helps people stick around and convert.
- Optimization Never Really Ends: This isn’t a one-and-done project. Improving page speed is a cycle. You measure, find the problems, apply fixes (like shrinking images or cleaning up code), and then you measure again.
- The Small Fixes Add Up: You probably don’t need to rebuild your whole site. Often, it’s the simple things—resizing an image, delaying a script, picking a better web host—that make the biggest difference in your Core Web Vitals scores.
What Exactly Are These Core Web Vitals Everyone’s Talking About?
You’ve definitely heard the term floating around. It pops up in Google Search Console warnings or gets mentioned in marketing meetings. But what does it really mean? Simply put, Google picked these three specific metrics to grade the actual experience a person has on your website. They’re your site’s vital signs.
This has nothing to do with keyword density or backlinks. This is purely about how your site performs for a human being.
The three vitals are:
- Largest Contentful Paint (LCP): This one just asks, “How long until the most important thing on this page shows up?” It measures the time it takes for the largest element, usually a big hero image or the main headline, to appear. A good LCP (under 2.5 seconds) is like a good first impression. It reassures the user that the page is working and the content is coming.
- Interaction to Next Paint (INP): This is the new kid on the block, replacing an older metric. INP measures how responsive your page is overall. When a user clicks a button, opens a menu, or fills out a form, how long does it take for something to visibly happen? INP answers the question, “Does this site feel snappy or does it feel broken and slow?” A low INP is key for a site that feels alive and interactive.
- Cumulative Layout Shift (CLS): This one is my personal pet peeve. You know when you try to tap a link, but an ad loads at the last second, pushing everything down so you click the ad by mistake? Infuriating, right? That’s a layout shift. CLS scores how much your page elements unexpectedly move around as the page loads. It answers, “Is this page stable, or is it a jumpy mess?” A score near zero is what you want.
When you look at these three together, you get a remarkably clear picture of your site’s health through your visitor’s eyes.
Why Should I Even Care About a Few Milliseconds?
This is the million-dollar question. It’s so easy to think, “Come on, it’s just an extra second. Who cares?” The hard truth? Everybody cares. The modern internet user has the patience of a gnat. Those milliseconds you’re dismissing are the difference between a new customer and a lost one. Caring about milliseconds means you care about your business.
Google is obsessed with user experience, so they’ve made Core Web Vitals a confirmed ranking signal. They want to send people to sites that work well. If two sites have similar content, the faster, more stable one is going to win in the search results. It’s that straightforward. Ignoring speed is like telling Google you’d rather not have the traffic.
Beyond that, think about what a slow site says about your brand. It feels sloppy. Unprofessional. It creates a feeling of frustration before your visitor even reads a word. If your website is sluggish, what does that imply about your customer service or the quality of your products? Speed signals competence. My old portfolio didn’t just load slowly; it told potential clients that I missed important details. That is not a good first impression.
And then there’s the direct hit to your conversions. Study after study confirms it: the longer a page takes to load, the more people leave. That bounce rate just climbs and climbs with every tick of the clock. People don’t wait. They click back. Improving your page speed isn’t just a chore for your developer; it’s one of the most powerful business decisions you can make.
How Do I Check My Site’s Current Page Speed Scores?
You can’t fix a problem you can’t see. The first step is always to get a baseline. You need to know where you stand right now. Luckily, you don’t have to guess. There are some fantastic—and free—tools that will diagnose your site and give you a clear report card.
Your first stop should be Google’s PageSpeed Insights. This is the source of truth. Since it’s Google’s own tool, you know the results are what the search engine itself is seeing. Just pop in your URL, and it gives you a 0-100 score for mobile and desktop, your specific Core Web Vitals numbers, and a prioritized list of “Opportunities.” This report is your roadmap. It will literally tell you what to fix, like “Eliminate render-blocking resources.” Start here.
Next, check out GTmetrix. This tool gives you a more detailed, visual breakdown of how your site loads, file-by-file. It’s called a waterfall chart, and it’s perfect for spotting that one enormous image or that slow third-party script that’s causing a traffic jam. It can help you find the exact culprit behind a slow load time.
Finally, if you’re comfortable digging a little deeper, the Lighthouse tool right inside Google Chrome’s Developer Tools is a powerhouse. You can run it on any page by right-clicking, hitting “Inspect,” and finding the Lighthouse tab. The big advantage here is that you can test pages on your own computer before you even publish them, making it a great way to check your work as you go.
Using these tools together gives you the full story and a clear path forward.
Is My Giant Hero Image Killing My LCP Score?
Let me guess: you have a big, beautiful image at the top of your homepage? Yeah, that’s probably your LCP problem. That image is often the largest thing the browser needs to load, and if it’s not handled perfectly, it can absolutely tank your score, leaving users staring at a white screen. It’s the most common performance issue I see, but the good news is that it’s usually easy to fix.
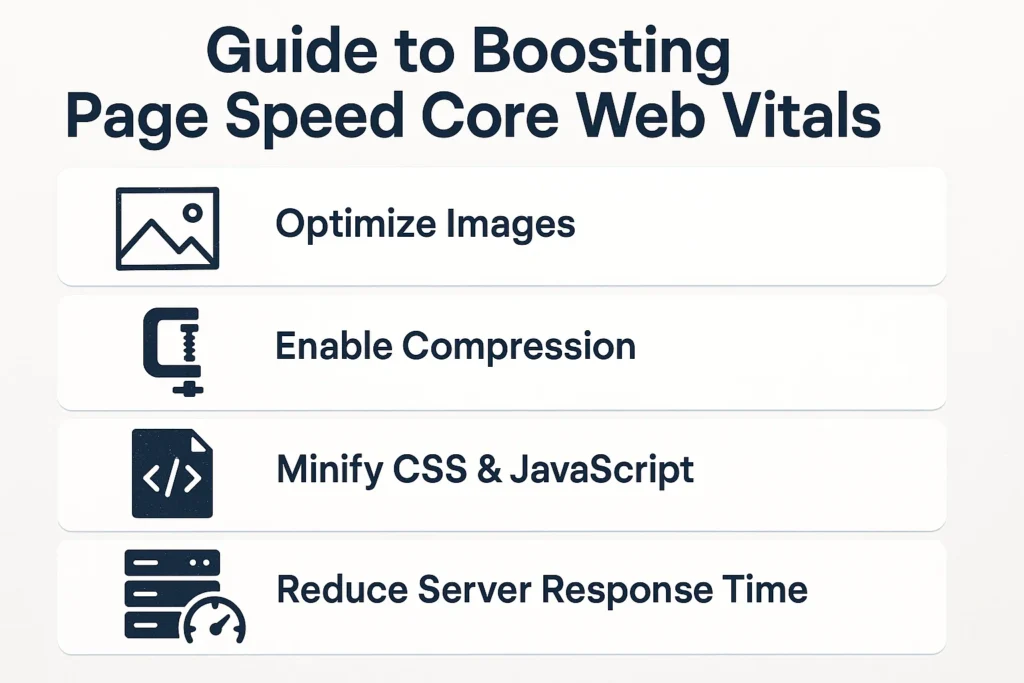
First things first: compress your images. Every single one. There is absolutely no excuse for uploading a 5 MB photo from your camera directly to your website. Online tools like TinyPNG or Squoosh can shrink your image files by huge amounts—often over 70%—without any noticeable difference in quality. This is the easiest win in all of web performance. Just do it.
Second, use modern image formats. For a long time, JPEG and PNG were the only options. Now, we have WebP and AVIF. These new formats provide much better compression, meaning smaller file sizes at the same quality. Most modern website platforms can automatically convert your images to WebP and will serve them to browsers that support it (while keeping a JPEG as a backup for older browsers).
Third, you have to serve the right-sized image for the screen. It is incredibly wasteful to force a tiny phone to download a giant 4000-pixel-wide image designed for a massive desktop monitor. Using responsive image code (like the srcset attribute) allows you to provide several sizes of an image. The browser then automatically picks the most efficient one based on the user’s screen.
Lastly, lazy load your other images. Lazy loading is a technique that tells the browser not to download images until the user scrolls down the page and they’re about to come into view. You don’t want to lazy load your main hero image (your LCP element), but it’s a fantastic strategy for every other image on the page.
What’s Clogging Up My Website’s “First Impression”?
When someone clicks a button on your site, they expect something to happen. Instantly. That tiny delay, that moment of unresponsiveness, is a bad user experience and a direct hit to your Interaction to Next Paint (INP) score. The reason for this lag is usually that the browser’s main thread is swamped with other work. And what’s the work? Almost always, it’s dealing with bloated JavaScript and CSS.
These are what we call render-blocking resources. The browser has to stop everything to download and process them before it can show the page or respond to your click. The key to a responsive site is getting these resources out of the way.
A hugely effective tactic is to defer non-critical JavaScript. Think about the script that runs your social media sharing buttons. Does that really need to load before the user can even read your headline? No. By adding a defer attribute to your script tag, you tell the browser to download it in the background and run it only after the rest of the page is ready. This gets it out of the critical path.
Another must-do is minification. Minifying your code strips out all the unnecessary stuff that humans need but computers don’t—things like comments, spaces, and line breaks. This makes the files smaller, so they download and run faster. Nearly all modern website development tools and caching plugins can do this for you automatically.
If your site is heavy on JavaScript, you may need to go a step further with code splitting. Instead of loading one giant JavaScript file for your entire site, code splitting breaks it into smaller pieces. The browser then only downloads the specific code needed for the page the user is on, making that initial interaction happen much, much faster.
Why Do My Page Elements Jump Around While Loading?
This is the one that makes people want to throw their phones. That chaotic, jarring experience where content shifts around on the page is what causes a bad Cumulative Layout Shift (CLS) score. It destroys user trust and makes your site feel amateurish. I once consulted for an e-commerce store where the “Add to Cart” button would shift down just as people went to click it. Sales went up the moment we fixed it.
This problem is almost always caused by loading elements without first telling the browser how much space they will take up. The browser starts drawing the page, and then an image or an ad finally loads and shoves all the other content out of the way.
The number one fix is incredibly simple: always put width and height attributes on your images and videos. Like this: <img src="my-image.jpg" width="800" height="450" alt="...">. When you do this, the browser knows the exact dimensions of the image before it even starts downloading. It can then reserve a perfectly sized empty box in the layout, and when the image loads, it just slots right in with zero shift. This one change can solve most of your CLS issues.
The same logic applies to anything you embed on the page, like ads or YouTube videos. You have to reserve the space. If you know an ad banner is 250 pixels tall, you should add min-height: 250px; to its container in your CSS. This holds the space open, preventing a layout shift when the ad finally appears.
Web fonts can be another sneaky cause. Sometimes a browser will show a default font for a split second before your fancy custom font loads. If they aren’t the same size, you get a flash of shifting text. Using modern CSS like font-display: swap; and preloading your most important font files can help make this swap much smoother and less jarring. For a deeper dive on all things web vitals, Google’s own web.dev platform is an invaluable resource.
Could My Web Host Be the Secret Culprit?
One hundred percent. You can follow every best practice, but if your site is built on a slow, rickety foundation, you’ll never achieve true speed. Your web host is that foundation. Choosing a cheap, overcrowded hosting plan is a common and critical mistake that sabotages performance from the very start.
There’s a key metric here called Time to First Byte (TTFB). This measures how long it takes for your server to even begin responding after a user requests your page. A high TTFB is a dead giveaway that your server itself is slow. No amount of front-end optimization can fix that initial delay. If your TTFB is consistently high, your hosting is the problem.
Most people start on cheap shared hosting. The price is tempting, but you get what you pay for. Your site is crammed onto a server with hundreds of others, all fighting for the same limited pool of resources like memory and processing power. If your “neighbor” gets a traffic spike, your site slows down. It’s a recipe for inconsistent performance.
For any website that matters to you, moving off shared hosting is a critical upgrade. A Virtual Private Server (VPS) is a big step up, giving you your own guaranteed resources. But for most people, the best option is quality Managed Hosting. These companies specialize in platforms like WordPress and fine-tune their servers for maximum speed. They also handle all the complex server maintenance, security, and caching for you. It costs more, but the massive performance boost and saved headaches are worth every penny.
Are Plugins and Third-Party Scripts Sabotaging My Speed?
Every single plugin you install and every third-party script you add comes at a price. That price is performance. Each one adds more files that have to be downloaded and more code that has to be run, and it adds up fast. It’s easy to fall victim to “death by a thousand cuts,” where the combined weight of all these little additions makes your site painfully slow.
In the WordPress world, we call this “plugin bloat.” It’s so easy to just keep adding plugins for every little feature. A contact form plugin here, a social media plugin there. Soon you have dozens active, and many of them are loading their own scripts and styles on every single page, dragging down performance across your entire site. You have to be disciplined. Regularly audit your plugins. If you don’t truly need it, get rid of it.
Then there are the third-party scripts. These are snippets of code that pull in resources from other companies’ servers. Think about:
- Google Analytics
- Facebook Pixel
- Live chat tools
- Ad network scripts
- Video embeds
The danger here is that their performance is completely out of your hands. If their server is slow, your site becomes slow. If their code is bloated, it bogs down your site. You have to be ruthless. Is that live chat widget actually generating leads, or is it just hurting the experience for the 99% of visitors who never use it? Test everything and remove any script that isn’t providing clear, measurable value.
How Can Caching Give Me an “Easy Win”?
If you want the most bang for your buck in the page speed game, you need to get serious about caching. Caching is just a fancy word for storing a ready-made version of your page so it can be served up lightning-fast. Instead of your server having to build the page from scratch for every single visitor, it can just hand them a copy it already prepared.
First, there’s browser caching. This is where you instruct the visitor’s web browser to save local copies of your files, like your logo, CSS, and JavaScript. When they come back to your site or visit another page, their browser can just load those files from their own computer instead of downloading them all over again. This makes a huge difference for repeat visitors.
Even more powerful is server-side caching (or page caching). On a dynamic site like WordPress, the server normally has to do a lot of work for each visit: run code, query the database, assemble the page, and then send it. Page caching skips all of that. The very first time a page is requested, the server does the work and then saves the final HTML file. From then on, it just serves that saved copy to everyone else instantly. This can have a massive impact on your server response time (TTFB) and make your site feel incredibly quick. For WordPress sites, plugins like WP Rocket or LiteSpeed Cache make this incredibly easy to set up.
The Journey to a Faster Site
Look, optimizing for Core Web Vitals isn’t a project you finish. It’s more like good housekeeping. The web changes, best practices evolve, and your site grows. You have to keep an eye on it. The goal is to make performance part of your regular maintenance routine, not a frantic, one-time fix.
Don’t let the technical terms scare you. Just start. Go run a PageSpeed Insights report. See what it says. Pick one thing from the top of the list—maybe it’s just compressing the images on your homepage—and fix it. You’ll be amazed at how much of a difference a few small, targeted changes can make.
Remember my story about that first portfolio? That painful lesson taught me that speed isn’t just a technical metric. It’s part of the user experience. It’s the first promise you make to your visitors. By making your site fast, you’re not just pleasing Google; you’re creating a better, more respectful, and more successful home for your brand on the web.
FAQ
What are Google’s Core Web Vitals and why are they important?
Google’s Core Web Vitals are three key metrics—Largest Contentful Paint (LCP), Interaction to Next Paint (INP), and Cumulative Layout Shift (CLS)—that measure user experience aspects of a website. They indicate how fast a page feels, how responsive it is, and whether it loads without surprise layout shifts. These metrics are important because they directly influence your site’s search ranking and impact user satisfaction.
How can I improve my website’s page speed and Core Web Vitals scores?
To improve your website’s Core Web Vitals scores, you should optimize images by compressing and using modern formats, defer non-critical scripts, minify code, serve appropriately sized images, implement caching strategies, and ensure layout stability by defining size attributes for images and embeds. Regularly test your site with tools like Google’s PageSpeed Insights, GTmetrix, and Lighthouse to identify and fix issues.
Why does my large hero image affect my LCP score, and how can I fix it?
Your large hero image impacts your LCP score because it is often the largest element on your page that needs to load first. To fix this, compress your image files, use modern formats like WebP, serve images at the right size for the device, and implement lazy loading for additional images. These steps reduce load time and improve your LCP score.


