
With Microsoft Power BI you can make the most of your data using coherent, visually immersive, and interactive insights. You can easily gather insights, analyse the collected data and share it with anyone you need to. All of this with the aim of helping you make better, more informed business decisions.
Microsoft Power BI is a collective of cloud-based apps and services that aid businesses in data collection management and analysis. Through a user-friendly interface, easy-to-process charts and visual graphs, users can reap the rewards of clear data insights.
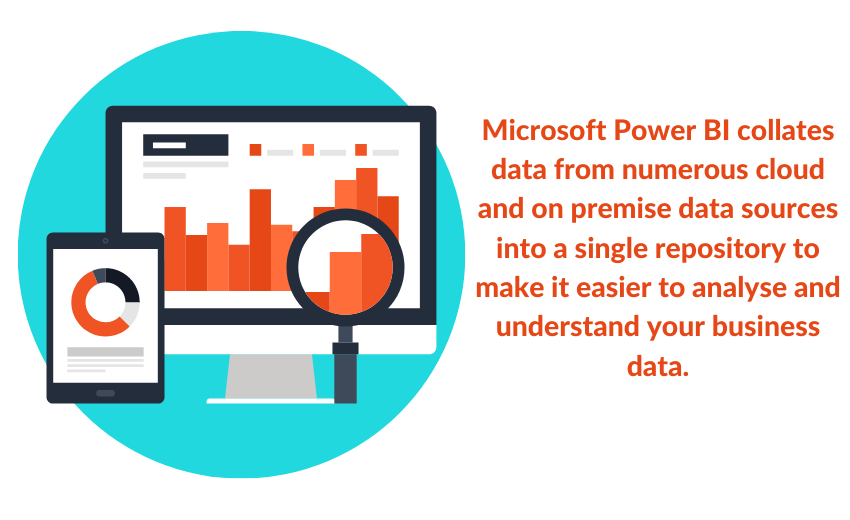
The main use of this software is to pull data together, process it and produce intelligible insights, which users can share freely. Using its analytical muscle, businesses can assemble, scrutinise, and visualise data from across the company.
The main aim of the software is to bridge the gap between data and decision-making.
Thanks to its machine learning capabilities, Power BI shows users not only what’s happened in the past and what’s happening in the present, but also what might happen in the future. With these insights, businesses can generate forecasts and be more prepared to meet future demands.
We collect more data than ever before and this information has become an essential commodity for businesses to utilise. However, collecting data and using it to your advantage are two different things. Business intelligence software such as Microsoft Power BI helps make sense of the robust amount of data collected to help you make more informed decisions.
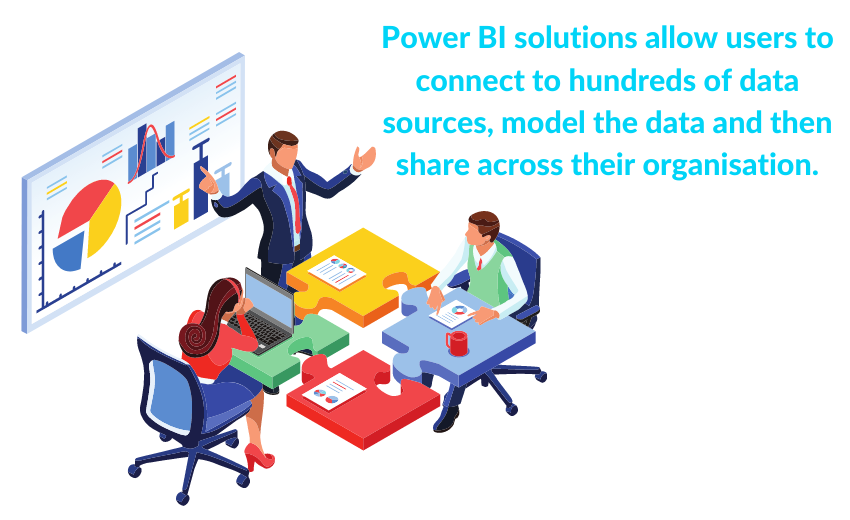
You can create reports for data harvested from services such as Xero, Adobe Marketing Cloud, SAP HANA, Salesforce, MailChimp, Marketo or Google Analytics to name the most popular. However, with the right expertise, you can transform data from almost any source and present it in an easy to digest format, that flags the key points relating to any team across your organisation.
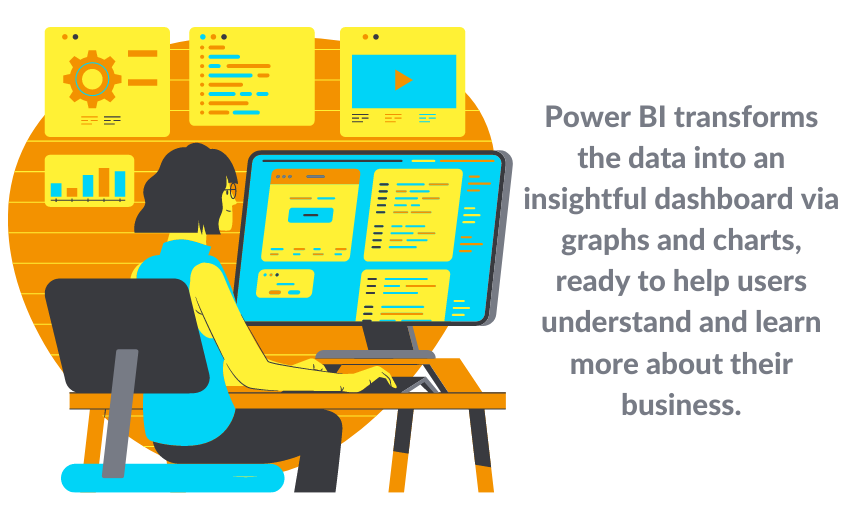
For a better data understanding, Power BI uses a range of custom charts, graphs and the Timeline Storyteller function, a custom visual option that creates a timeline from your data. You will be able to see the progress of your business over time, including any shift in demand, any patterns or sequences of note.
Power BI contains a good range of visualisations, however, you can add more if you need to, by downloading them from the Office Store or by creating your own with the open-source Power BI Custom Visual Tool.
With Power BI you can use the natural language capability to ask questions and get visualised responses and you can further pin the visualisation to your dashboard and share it across the business if required.
By typing a question, the program will give inline suggestions to help you organise your data in a manageable fashion.
There are a number of versions of Power BI to choose from, differing in price, features and deployment methods. These versions include:
Microsoft Power BI can also be used to visualise data for IT monitoring tools. The Power BI solution template for Azure Activity Logs uses an Azure SQL database and Stream Analytics to collect logs and display those using pre-built Power BI Desktop reports. To find out more about Microsoft Azure read our blog article.
Microsoft Power BI is highly customisable, with user-friendly dashboards and interfaces. You can visualise data the way you want to and share it with your co-workers. This software can supply you with useful, actionable insights from your data so that you can make better business decisions.
To find out more about Power BI and how it can help your business get in contact with our IT team.

Digital Marketing Executive
Wiktoria lives to create, she is a marketing postgraduate who loves social media and content creation. Customer satisfaction and driving engagement is at the heart of her work. She has worked with different clients including fintechs, affiliate marketing agencies and NGOs for over 3 years to grow their brands, as well as provide them with original and creative content. Since joining Rank Your Domain, Tori has focused on content creation and social media marketing.


 ISO 27001
 ISO 9001
 ISO 13485
 ISO 14001